


Monitoring your application allows you to optimize its performance, ensuring that it is running at its best at all times. By tracking key performance metrics such as CPU usage, memory usage, requests per minute, and latency, you can identify any bottlenecks or inefficiencies that may be affecting its performance. This data gives you valuable insights into how your application is performing and allows you to make informed decisions to improve its overall efficiency.
The Benefits of Monitoring App Health

Monitoring app health offers numerous benefits, including performance tracking and the ability to measure user experience metrics, leading to a better functioning app and increased user satisfaction. By continuously monitoring various aspects of your application’s performance, you can identify bottlenecks, optimize resource allocation, and ensure the smooth functioning of your app.
One of the key benefits of monitoring app health is performance tracking. By tracking metrics such as CPU usage, memory usage, and requests per minute, you can gain insight into how your application is performing. This data allows you to identify areas of improvement and optimize performance, ensuring that your app runs smoothly even under high load.
In addition to performance tracking, monitoring app health also enables you to measure user experience metrics. By tracking metrics such as latency and user satisfaction, you can gain valuable insights into how your app is being perceived by users. This data helps you understand the user experience better and make informed decisions on how to improve it, ultimately increasing user satisfaction and engagement.
Overall, monitoring app health is essential for maintaining the optimal performance and user experience of your application. By continuously tracking performance metrics and user experience, you can identify areas for improvement, optimize resource allocation, and ensure the smooth functioning of your app. With the ability to measure and monitor these crucial aspects, you can drive the success of your application in today’s digital landscape.
Table 1: Metrics for Monitoring App Health
| Metric | Description |
|---|---|
| CPU Usage | Percentage of CPU resources being used by the application |
| Memory Usage | Amount of memory being utilized by the application |
| Requests per Minute | Number of HTTP requests received by the application per minute |
| Latency | Time taken for a request to travel from the client to the server and back |
| User Satisfaction | Feedback or ratings provided by users on their experience with the application |
High Uptime with Uptime Monitoring
Uptime monitoring plays a crucial role in ensuring the high availability and reliability of your application, allowing you to address potential downtimes and optimize performance effectively. By continuously monitoring the uptime of your application, you can proactively identify and resolve any issues that may arise, minimizing any negative impact on your users and your business.
One effective way to monitor uptime is by tracking performance metrics such as CPU usage, memory usage, and requests per minute. These metrics provide valuable insights into the overall health of your application and can help you identify any areas that need improvement. By regularly analyzing these metrics, you can detect and resolve performance bottlenecks before they cause significant disruptions.
In addition to performance tracking, it is essential to monitor security exposure and error rates to ensure the security of your application. By keeping a close eye on these metrics, you can identify and address vulnerabilities before they are exploited, protecting your application and your users from potential threats.
Garbage collection performance and request rates are also critical metrics to consider when monitoring your application’s uptime and performance. Proper garbage collection management helps optimize memory usage and prevent memory leaks, leading to improved overall performance.
Monitoring and analyzing request rates can help identify any potential bottlenecks in your application’s resources, allowing you to allocate them more efficiently and enhance user experience.

To effectively monitor your application’s uptime and performance, it is essential to have a dedicated security manager who can oversee the monitoring process. A security manager plays a vital role in communicating the importance of security within your organization and ensuring that all necessary measures are in place to protect your application from unexpected events. They can help establish protocols to respond to security incidents promptly and minimize any potential damage.
Overall, uptime monitoring is an imperative part of maintaining a high-performing and reliable application. By tracking performance metrics, monitoring security exposure, optimizing garbage collection performance, and analyzing request rates, you can proactively address issues, optimize performance, and ensure the continued success of your application in the ever-evolving digital landscape.
| Performance Metrics | Security Metrics |
|---|---|
| CPU usage | Security exposure |
| Memory usage | Error rates |
| Requests per minute | |
| Latency | |
| User satisfaction |
Identifying and Addressing Performance Issues
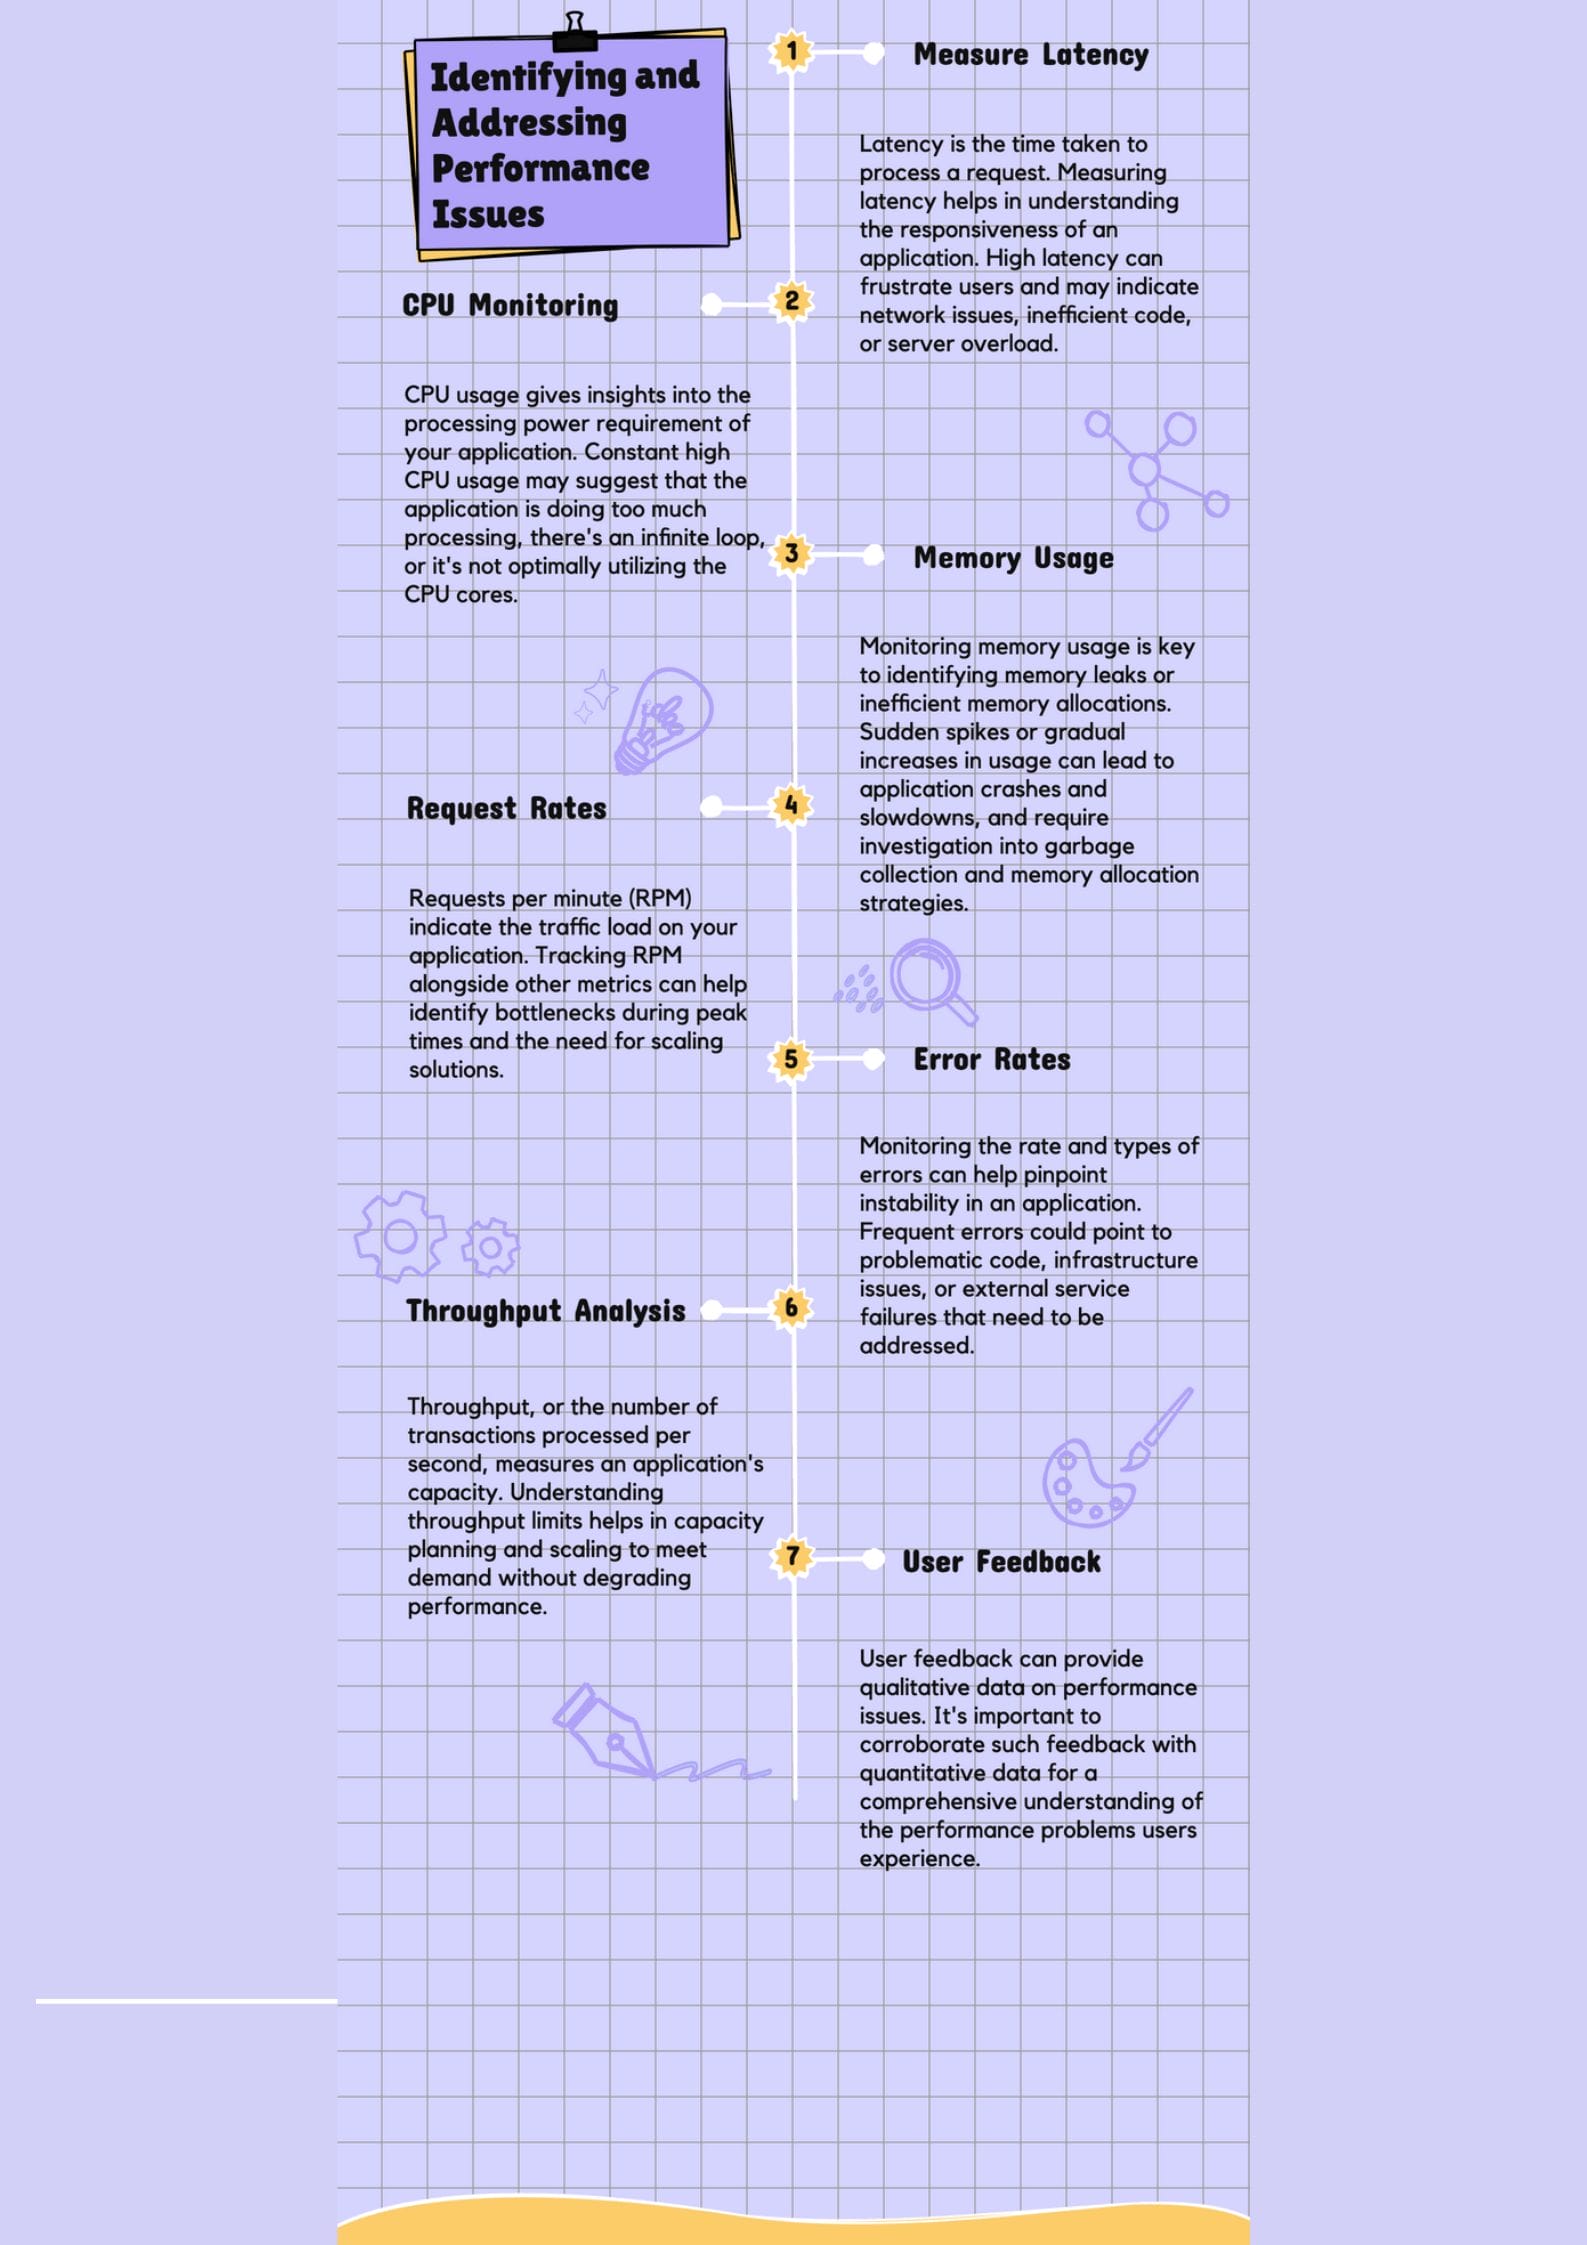
Tracking performance metrics, including latency, CPU usage, memory usage, and requests per minute, is essential for identifying and addressing performance issues in your application. These metrics provide insights into how your application is performing and can help you pinpoint potential bottlenecks or areas for improvement. By monitoring these metrics regularly, you can proactively identify and address performance issues before they impact the user experience.
Latency, or the time it takes for data to travel between client and server, is a critical metric to track. High latency can result in slow loading times and a poor user experience. By monitoring latency, you can identify network or server issues and take steps to optimize performance.
CPU and memory usage are key metrics for evaluating system performance. High CPU usage can indicate that your application is under strain and may need optimization. Similarly, high memory usage can lead to performance degradation. By tracking these metrics, you can identify resource-intensive processes or memory leaks that may be affecting performance and take appropriate measures to resolve them.
Requests per minute is another important metric to monitor. It helps you understand the workload on your application and can reveal patterns or spikes in traffic that may impact performance. By analyzing request rates, you can scale your infrastructure to handle increased traffic and ensure optimal performance.
| Metric | Description |
|---|---|
| Latency | Measures the time it takes for data to travel between client and server. |
| CPU Usage | Tracks the amount of CPU resources consumed by your application. |
| Memory Usage | Monitors the amount of memory used by your application. |
| Requests per Minute | Counts the number of requests made to your application within a minute. |
By monitoring these performance metrics, you can gain valuable insights into the health of your application and make informed decisions to optimize its performance. Regular monitoring allows you to stay proactive, anticipate issues, and continuously improve the user experience.
Security with Effective Monitoring
Effective monitoring of security exposure and error rates is crucial in enhancing the security of your application, allowing you to identify and fix vulnerabilities before they lead to significant failures. In today’s digital landscape, where cyber threats are constantly evolving, it is essential to have robust monitoring systems in place to protect your application and its users.
One key aspect of application monitoring is tracking security exposure. By continuously monitoring and analyzing your application’s security exposure, you can identify potential weak points and take proactive measures to strengthen your security measures. This includes identifying any outdated or vulnerable software components, verifying proper access controls, and regularly scanning for possible security breaches.

Error rates are another critical metric to monitor when it comes to application security. By tracking error rates, you can proactively identify and address potential vulnerabilities that may be exploited by malicious actors. High error rates can indicate security loopholes or coding errors that need immediate attention. With effective monitoring, you can quickly detect and resolve these issues, minimizing the risk of an application-wide failure or data breach.
| Benefits of Effective Security Monitoring: |
|---|
| Identification of weak points in application security |
| Proactive measures to strengthen security |
| Timely detection and resolution of vulnerabilities |
| Minimization of application-wide failures or breaches |
By incorporating effective monitoring practices, you can ensure the security of your application and protect your users’ sensitive data. It is crucial to have a dedicated security manager who can oversee the monitoring process, analyze security metrics, and implement necessary controls to mitigate potential risks. With a comprehensive monitoring strategy, you can stay one step ahead of threats and maintain a robust and secure application ecosystem.
Optimizing Garbage Collection Performance
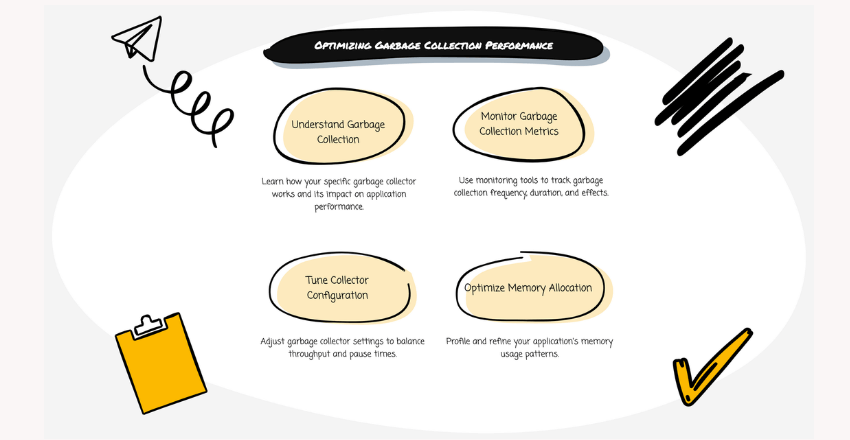
Monitoring and optimizing garbage collection performance is vital for ensuring efficient memory management and improving overall application performance. Garbage collection is the process of automatically reclaiming memory that is no longer in use by the application, freeing up resources and preventing memory leaks.
When monitoring garbage collection performance, developers should track metrics such as heap size, garbage collection cycles, and pause times. Heap size refers to the amount of memory allocated for the application’s objects, while garbage collection cycles measure how often the garbage collector runs to reclaim memory. Pause times indicate the duration of the pauses in application execution caused by garbage collection.
By analyzing these metrics, developers can identify any inefficiencies in garbage collection and take steps to optimize performance. This may involve adjusting the garbage collector’s settings, such as the heap size or the frequency of garbage collection cycles, to better align with the application’s memory usage patterns. Additionally, developers can use profiling tools to pinpoint specific areas of code that generate excessive garbage, allowing them to optimize those sections for better memory management.
Analyzing Request Rates for Performance Optimization
Analyzing request rates is essential for optimizing application performance, as it allows you to identify bottlenecks and effectively allocate resources. By monitoring the rate at which requests are made to your application, you can gain valuable insights into its overall performance and identify areas that need improvement.
One way to analyze request rates is by tracking the number of requests per minute. This metric helps you understand the load on your application and whether it can handle the influx of incoming requests. By comparing the request rate with other performance metrics such as CPU usage and memory usage, you can pinpoint any potential bottlenecks that might be impacting the overall performance of your application.
Another important aspect to consider when analyzing request rates is response time or latency. Monitoring the time it takes for a request to be processed by your application gives you an indication of how quickly your application can respond to user actions. By tracking latency, you can identify any delays or inefficiencies in your application’s performance and take necessary steps to optimize it.
| Metric | Definition |
|---|---|
| CPU Usage | The percentage of the CPU’s processing power utilized by your application. |
| Memory Usage | The amount of memory consumed by your application. |
| Requests per Minute | The number of requests made to your application within a minute. |
| Latency | The time it takes for a request to be processed and receive a response from your application. |
To effectively optimize your application’s performance based on request rates, it is crucial to have a thorough understanding of these metrics and their implications. Regularly monitoring and analyzing request rates can help you identify patterns, predict future load, and make informed decisions to improve the overall performance and user experience of your application.
The Role of a Security Manager in Application Monitoring

A dedicated security manager plays a pivotal role in application monitoring, as they effectively communicate the importance of security, garner organizational support, and plan for unexpected events. In today’s digital landscape, where cyber threats are increasingly prevalent, having a security manager is crucial for ensuring the protection of your application and its sensitive data.
One of the key responsibilities of a security manager is to monitor and analyze security exposure and error rates. By constantly monitoring these metrics, they can identify potential vulnerabilities and take proactive measures to address them before they become major security breaches. This includes implementing robust security measures, such as firewalls, encryption protocols, and intrusion detection systems, to safeguard the application from unauthorized access and malicious attacks.
Furthermore, a security manager plays a vital role in fostering a culture of security awareness within the organization. They educate employees about the importance of following security best practices, such as using strong passwords, regularly updating software, and being cautious of phishing attempts. By raising security awareness, they empower employees to actively contribute to the protection of the application and its data.
In addition to proactive security measures, a security manager also plays a critical role in planning for unexpected events. They develop incident response plans and conduct regular drills to ensure the organization is prepared to handle security incidents effectively. By having a well-defined and tested plan in place, the organization can minimize the impact of security incidents and quickly restore the application’s functionality.
Table: Responsibilities of a Security Manager in Application Monitoring
| Responsibility | Description |
|---|---|
| Monitor security exposure and error rates | Constantly monitor metrics related to security exposure and error rates to identify vulnerabilities and potential security breaches. |
| Implement security measures | Implement robust security measures, such as firewalls, encryption protocols, and intrusion detection systems, to protect the application from unauthorized access and attacks. |
| Educate employees | Raise security awareness among employees and educate them about best practices to actively contribute to the protection of the application and its data. |
| Plan for unexpected events | Develop incident response plans and conduct regular drills to ensure the organization is prepared to handle security incidents effectively. |
Wrapping up
Monitoring your application is of utmost importance to optimize performance, anticipate issues, and ultimately drive success in today’s digital landscape. By continuously monitoring key performance metrics such as CPU usage, memory usage, requests per minute, latency, and user satisfaction, developers can identify areas for improvement and ensure the smooth functioning of their applications.
Apart from performance tracking, monitoring security exposure and error rates is crucial for identifying and fixing vulnerabilities before they lead to significant failures. Garbage collection performance and request rates are additional metrics that can provide insights into application performance and resource allocation optimization.
To effectively monitor your application, it is essential to have a dedicated security manager who can communicate the importance of security, garner support within the organization, and plan for unexpected events. This role plays a critical part in ensuring that your application remains secure and protected.
External Links
https://www.dynatrace.com/support/help/platform-modules/digital-experience/synthetic-monitoring
https://nces.ed.gov/pubs98/safetech/chapter4.asp


 We use cookies to ensure that we give you the best experience on our website and show you relevant advertising. If you continue to use this site we will assume that you are happy with it. To find out more read our