Runscope provides a way to log HTTP traffic that passes between client and server and it also can also continuously monitor Web API’s to ensure they are functioning correctly. When something goes wrong with the Web API you can be notified immediately. However, out of the box, there isn’t a way to be notified if there a failure appears in the traffic log. However, it can be done, it just requires a little creativity. This blog post shows how.

The API to the rescue
The Blazemeter Traffic Inspector is where you can see all the requests that have been relayed by Runscope. Requests that have failed, based on their status code or connectivity issue, are included in the Errors stream.
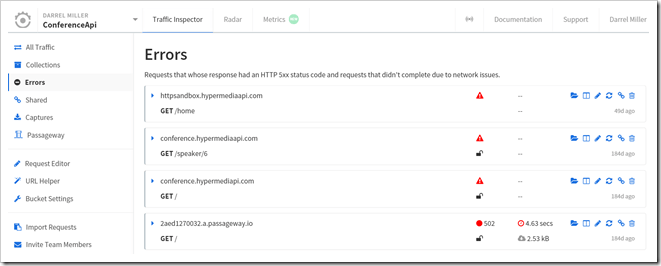
We can create a Radar Test that looks in this Errors stream by making a request to the Runscope API.

Unfortunately, it’s not quite that simple. Once an error is in the Errors stream, the Radar test would end up notifying us of an error every time it checked. We need a way of asking if any requests have been added to the Errors stream since the last time we ran the test.

We can also use the API to look at the results of a test and determine when it was last run.

We can use the started_at timestamp from the response body of the last test run to then query the errors stream for requests since that timestamp.
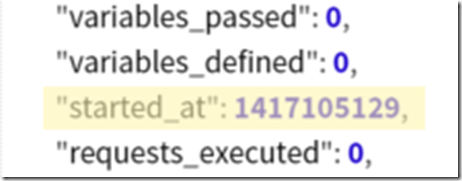
There is the possibility that if requests happen between the time that the test starts and the time the errors collection is queried, that the error may be reported twice. This seems like a better alternative than using the finished_at and risk missing an error than comes in whilst the test is running.
Accessing the API
In order to use the Runscope API we need an API Key. We can get one of those by defining an Application within Runscope account configuration.

The Website URL and Callback URL are dummy values because your account is the only one who will access the API and therefore you don’t need to use OAuth2 web flow authentication. Once you create the application you will find a Access Token at the bottom of the page.

We will now be able to use this access token in our tests.
Creating the Tests
Before creating the tests we should create a new Bucket to hold the tests. I called this bucket “Traffic Tester”. By using a different bucket we can avoid getting the traffic relating to monitoring intermixed with our actual relayed traffic. Make a note of the “Traffic Tester” bucket key which is displayed in the bottom left corner of the Traffic Inspector screen.
The next step is to go to the Radar view and create a test. I created a test called “Monitor Slackbot Traffic” as I want to use it to notify me if there are any errors that occur in my Slackbot integration.
Identifying the Test itself
The first request that we add to this test is going to determine the last time that the test was run. Before we can do this, we need to know the UUID of the test. We can use the API to tell us this. So initially, we are going to set up the first request to just determine the UUID.
Set the request URI to be
In my case the URI looked like this, your bucket key will be different,

You will also need to add a Authorization header that has a value that has this format,
bearer {APIKey}
My header looked something like this.

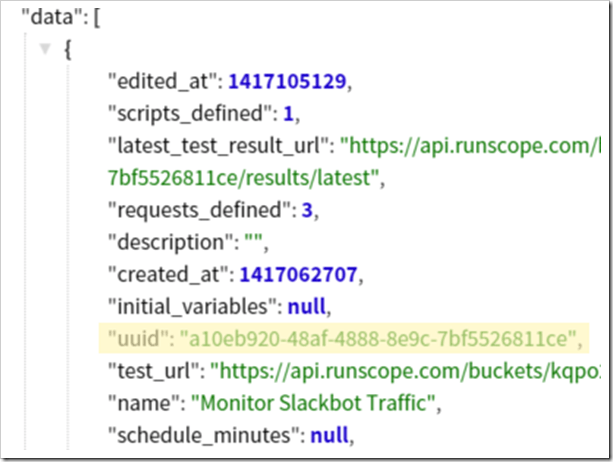
Run this test and when it succeeds, check the Last Response value. This JSON object is a description of our “Monitor Slackbot Traffic” test and it contains a UUID property to identify the test. Copy that UUID value.
Getting the “Since” value
Change the URL of the test to be,
replacing both the bucket key {TrafficTesterBucketKey} and {TestUUID} values. Next, add a Variable named since like this,

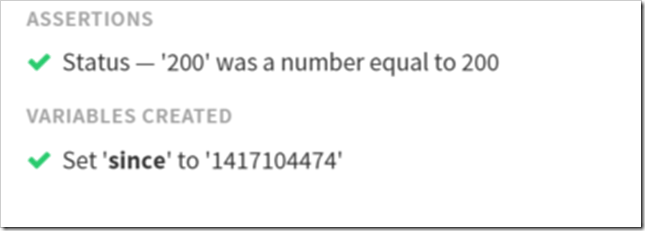
We get the started_at value of data[1] instead of data[0] because data[0] is the information about the currently running test. We want to know when the last test started.
At this point you can try running the test and see if it populates the since variable with a timestamp value.
Time to Check the Errors Stream
Create the next request and set up the same Authorization header as the previous request.
Set the new request URL to be
Replace {bucketToMonitor} with the bucket key of the bucket you wish to monitor!
When the request runs it will return a data array that either contains errors or does not. I tried to use the standard assertions for this but could not find a way that could handle the empty array. So instead, I used a bit of script code to do the check.
Add the following script code to the request to complete the request,

Tell somebody about it
Add some notifications to the test,
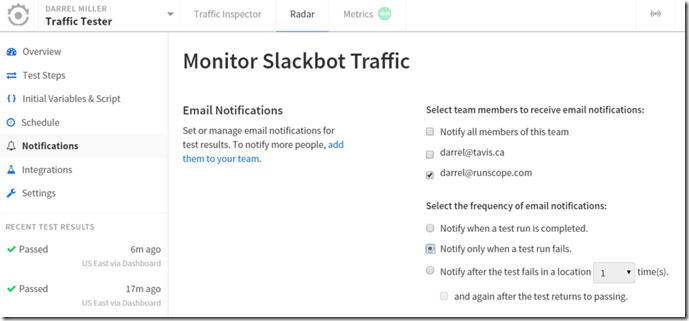
This will send you an email if any request gets captured in the Errors stream. If you prefer to use some other notification method then select the Integrations page and select one of our many integration partners.
Is this useful to you?
Ideally, it shouldn’t require quite this much creativity to be able to do this. Let me know if this is useful to you and we’ll find a way of making it much simpler.
Image Credit: Canary https://flic.kr/p/c2fdZG


